 eduzyeduzy
Basic
31 Lessons
5h 24m of video
1 Students
Certificate of Completion
You use Excel every day but still spend a lot of time to clean data, write formulas, calculate KPI, or verify figures? 🤯
You want Excel to be not just a place to enter data, but truly become a tool that supports work and decision-making?
🚀 Excel Business Essentials is designed to help you build an Excel foundation following real-world work thinking: DATA → CLEAN → FORMULA → KPI
Instead of learning Excel by memorizing a bunch of functions and disconnected operations, you will learn through workflows and real business problems, from raw data to a complete KPI table.
This course is suitable for:
👩💼 Office staff who want to use Excel more effectively in daily work.
📈 Business staff / Sales who need to track revenue, orders, KPI, bonuses, and performance.
💰 Accountants who need to aggregate, verify, and calculate figures accurately.
👥 Human Resources / HCNS who regularly work with employee data, departments, and reports.
⚙️ Operations staff who need to process and verify data before creating reports.
🎓 Students and Excel beginners who want to build a practical Excel foundation for work.
No advanced Excel knowledge required. You only need to know basic operations such as opening/saving files, entering data, and simple cell formatting.
After about 5 hours of learning and practice, you can:
✅ Understand how a business data table should be organized.
✅ Identify common data errors before starting calculations.
✅ Convert data into an Excel Table for easier management, filtering, and expansion.
✅ Use core Excel formulas to solve business problems.
✅ Calculate Revenue, Orders, Average Order Value (AOV), KPI and Bonus.
✅ Use SUMIFS, COUNTIFS, AVERAGEIFS, IF, AND, OR, IFERROR, ROUND in real-world situations.
✅ Check formula logic and reconcile results instead of relying only on whether Excel reports an error.
✅ Complete a workbook following the process:
RAW DATA → CLEAN DATA → KPI TABLE 📊
⏱️ 60 minutes
You will learn how to read and organize a standard business dataset:
🔹 Row, Column, Record, Field, Header 🔹 Distinguish Text / Number / Date data 🔹 Get familiar with Excel Table 🔹 Sort, Filter, Freeze Panes 🔹 Important rule: 1 row = 1 transaction, 1 column = 1 attribute 🔹 Identify layout errors such as Merge Cell, blank rows, or placing total rows in the middle of the data range.
💡 Practice: Work directly with a sample sales file of about 500–1.000 rows, convert data into an Excel Table, and filter data by region, product, and status.
📁 Output deliverable: 01_DATA_STANDARDIZED
⏱️ 45 minutes
Real-world data is rarely perfect. Therefore, before calculating KPI, you need to know how to detect and handle common errors such as:
🧹 Blank / Null 🧹 Duplicate 🧹 Extra spaces 🧹 Inconsistent text 🧹 Inconsistent dates 🧹 Number stored as Text 🧹 Inconsistent region, department, or status names.
💡 Practice: Detect 8–10 intentionally planted errors in the dataset, then clean them and note cases that require manual checking.
📁 Output deliverable: 02_CLEAN_DATA
⏱️ 120 minutes
This is the core module of the course 🔥
You will learn how to use groups of Excel functions that are frequently used in business problems:
📌 SUM — aggregate data 📌 SUMIFS — sum by condition 📌 COUNTIFS — count transactions by condition 📌 AVERAGEIFS — average by condition 📌 IF — classify results 📌 AND / OR — combine multiple business conditions 📌 IFERROR — handle display errors 📌 ROUND — round numbers 📌 Some Text / Date functions needed for each problem.
💰 Calculate Total Revenue 🧾 Calculate Total Orders 📊 Calculate Average Order Value (AOV) 👤 Analyze revenue by employee 🌍 Analyze revenue by region 🎯 Determine Met / Not Met KPI status 🎁 Calculate bonuses based on revenue and KPI conditions.
In particular, the course does not only focus on “writing correct syntax”, but also guides you on how to check formula logic and reconcile results.
📁 Output deliverable: 03_KPI_CALCULATION
⏱️ 45 minutes
In the final part, you will connect all the knowledge you have learned into a complete business scenario.
📌 Context:
You are a Business Department support staff. A manager sends you a sales file with data errors and asks you to quickly create a KPI table to evaluate employee performance.
You will:
➡️ Read the business requirements ➡️ Identify the metrics to calculate ➡️ Identify the data source ➡️ Complete the KPI table ➡️ Check sample results ➡️ Detect and handle errors in the workbook.
You will practice calculating:
💰 Revenue 🧾 Orders 📊 AOV ↩️ Return Rate 🎯 KPI Status 🎁 Bonus
📁 Output deliverable: A complete workbook including:
RAW DATA → CLEAN DATA → KPI TABLE
This is the part that helps you verify whether you can actually do it or not.
You will start with a sales file containing data errors and complete the entire process yourself:
Standardize the data structure and convert it into an Excel Table.
Handle basic errors:
🧹 Blank 🔄 Duplicate 🔢 Number / Text 📅 Dates
Calculate the metrics:
💰 Total Revenue 🧾 Total Orders 📊 Average Order Value ↩️ Return Rate
Determine employees who Met / Not Met KPI according to the provided conditions.
Calculate Bonus using IF combined with AND/OR and manually check at least 3 cases.
📄 01_RAW_DATA — original data kept unchanged
📄 02_CLEAN_DATA — cleaned data
📄 03_KPI_TABLE — complete KPI table
📝 Short notes on the data errors detected.
More importantly, the workbook must ensure formulas are logically correct, do not change the original data, include a method for reconciling results, and have a readable layout.
This is not about learning Excel by “memorizing functions” ❌
Instead, the course follows this method:
Each concept is implemented in a cycle:
Problem → Formula/Operation → Check → Fix Errors 🔄
The instructor focuses on the thinking behind choosing formulas and how to check results, helping you understand the essence instead of just memorizing syntax.
☑️ Understand standard tabular data ☑️ Clean basic data errors ☑️ Use SUMIFS / COUNTIFS / AVERAGEIFS ☑️ Use IF / AND / OR ☑️ Calculate basic KPI ☑️ Know how to Verify and reconcile results ☑️ Complete an Excel workbook following a real-world workflow.
💡 No unfocused learning — focus on Excel skills that are highly applicable at work.
💡 Not just learning formulas — you also learn how to read data, clean data, and check results.
💡 Learn with real-world data — the course is filled with datasets and problems set in a business context.
💡 Clear output deliverables — at the end of the course, you complete a workbook from raw data to a KPI table.
💡 Build a foundation for advanced learning — the course 1 workbook can continue to be used as input for Excel Business Analytics, where learners continue with Lookup, advanced Data Cleaning, and PivotTable.
⏱️ Duration: About 5 hours / 300 minutes 🎯 Approach: Concise – Easy to apply – With output deliverables 💼 Method: Learn through workflows and real-world problems 📊 Focus: Data – Formula – KPI 👨💻 Learning format: Learn and practice directly on the dataset throughout the course.
Excel is not just cells and formulas.
The important thing is that you know:
📥 Receive data → 🧹 Clean → 🧮 Calculate → 🎯 Measure KPI → ✅ Check → 📊 Create reports
And that is the foundational capability that Excel Business Essentials aims for.
4 chapters
31 lessons
5h 24m of video
1 Students
24/7 mentor support
Certificate of completion
Learn on any device
0 VND
/ 1 months
4 Chapter · 31 Lessons · 5h 24m of video · 31 practice quizzes
7 Lessons • 1 hr 20 min
1.1 Don't write formulas immediately – Understand data before calculating
Preview12:061.2 Row, Column, Record, Field and Header – Understand data table structure
Preview8:341.3 Data types in Excel: Text, Number and Date
Preview13:071.4 Standardize Dataset with Excel Table
Preview9:491.5 Read data quickly with Sort, Filter and Freeze Panes
Preview15:591.6 Dataset Standardization & Pre-analysis Checks
20:00Capstone Lesson 1
7 Lessons • 1 hr 10 min
2.1 Data Cleaning mindset – Why clean data before calculating?
18:132.2 Blank / Missing Data – Detect and handle missing data
10:482.3 Duplicate – Identify duplicates based on Transaction Key
13:442.4 Whitespace and Text Standardization – Bring data to a consistent business standard
16:202.5 Date and Number Stored as Text – Standardize data types before analysis
2.6 Final Cleaning Check – Verify data and finalize Sheet 02_CLEAN_DATA
11:10Capstone Lesson 2
11 Lessons • 1 hr 57 min
3.0 Formula Problem-Solving Mindset – From Business Requirements to Excel Formulas
9:343.1 SUM – Basic Data Aggregation
10:153.2 SUMIFS – Sum by One or Multiple Conditions
16:433.3 COUNTIFS – Count Transactions by Business Conditions
9:413.4 AVERAGEIFS and Average Order Value
3.5 IF – Classify results and evaluate KPI
8:423.6 AND / OR – Create multi-condition KPI
13:473.7 IFERROR and ROUND – Handle display errors and standardize results
21:493.8 Text and Date basics – Handle data when formulas require
10:053.9 Complete KPI Table and Verify formulas
14:51Capstone Lesson 3
6 Lessons • 58 min
4.1 Understand the Problem before Writing Formulas – From Business Request to KPI
7:584.2 Validate Data before Calculating KPI – From RAW DATA to CLEAN DATA
14:394.3 Build KPI Sales Performance Table – Aggregate Employee Data
7:194.4 KPI Status and Bonus – Convert Business Rule into Excel Logic
7:194.5 Verify Results & Mini Challenge – Complete Mini Business Case
16:38Final Capstone Project
4:270 Rating and review
No comment
 gold
gold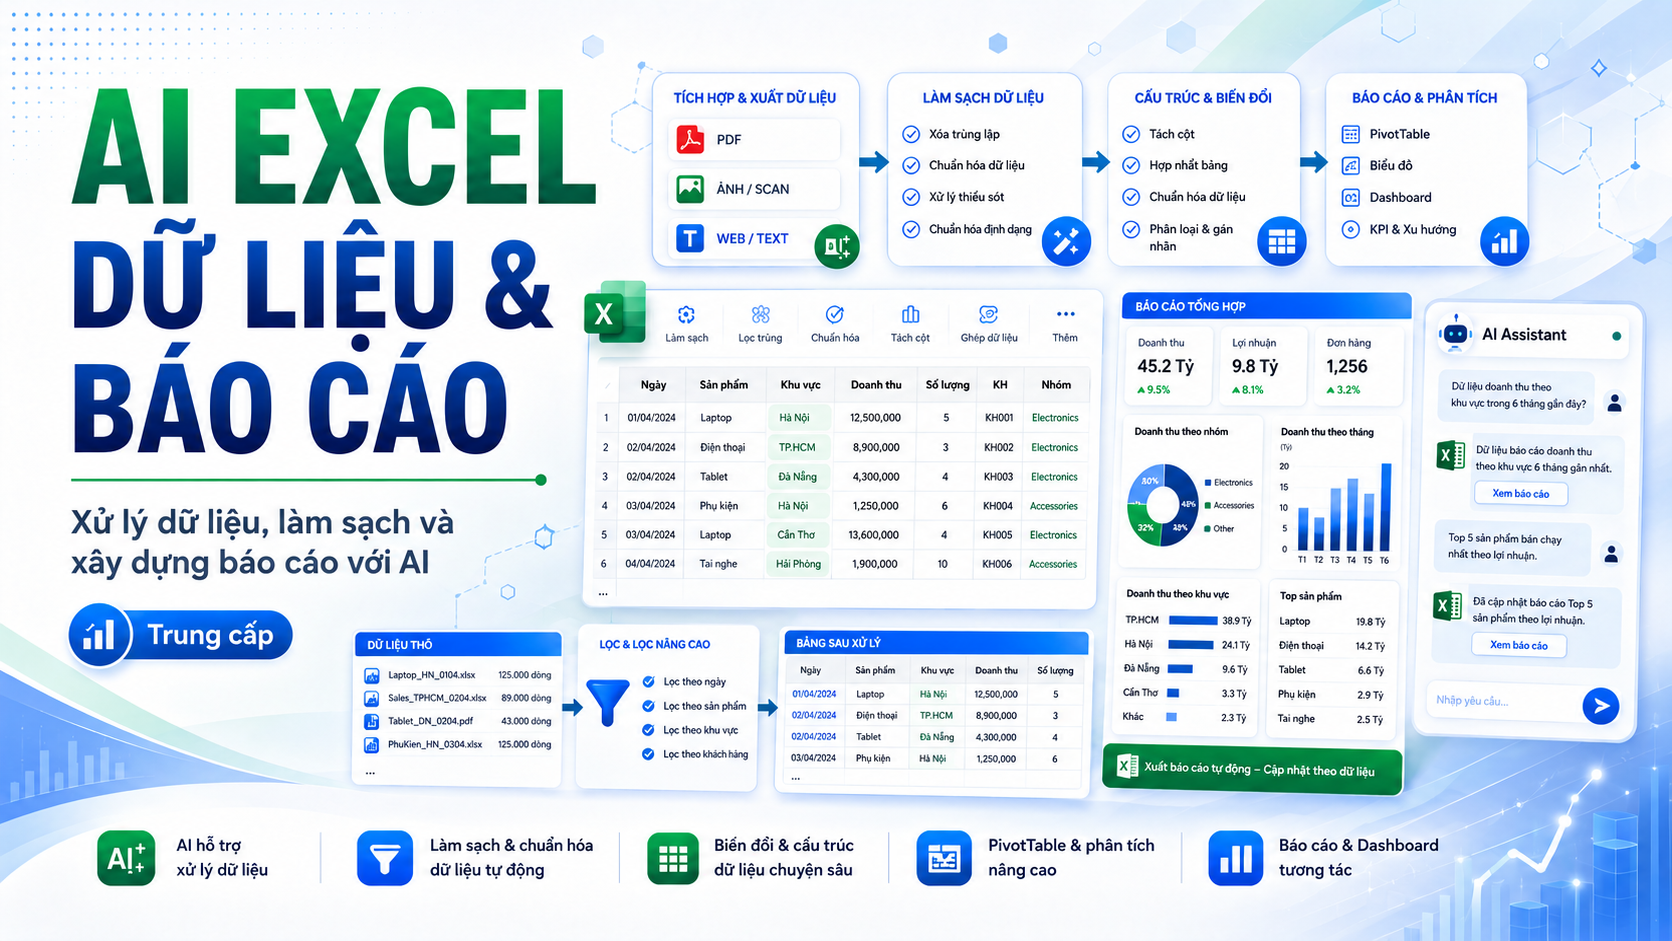
AI xử lý dữ liệu và báo cáo Excel
📊 AI EXCEL DATA & REPORTING Xử lý dữ liệu, làm sạch và xây dựng báo cáo với AI Bạn đã biết sử dụng Excel cơ bản và có...You use Excel every day but still spend a lot of time to clean data, write formulas, calculate KPI, or verify figures? 🤯
You want Excel to be not just a place to enter data, but truly become a tool that supports work and decision-making?
🚀 Excel Business Essentials is designed to help you build an Excel foundation following real-world work thinking: DATA → CLEAN → FORMULA → KPI
Instead of learning Excel by memorizing a bunch of functions and disconnected operations, you will learn through workflows and real business problems, from raw data to a complete KPI table.
This course is suitable for:
👩💼 Office staff who want to use Excel more effectively in daily work.
📈 Business staff / Sales who need to track revenue, orders, KPI, bonuses, and performance.
💰 Accountants who need to aggregate, verify, and calculate figures accurately.
👥 Human Resources / HCNS who regularly work with employee data, departments, and reports.
⚙️ Operations staff who need to process and verify data before creating reports.
🎓 Students and Excel beginners who want to build a practical Excel foundation for work.
No advanced Excel knowledge required. You only need to know basic operations such as opening/saving files, entering data, and simple cell formatting.
After about 5 hours of learning and practice, you can:
✅ Understand how a business data table should be organized.
✅ Identify common data errors before starting calculations.
✅ Convert data into an Excel Table for easier management, filtering, and expansion.
✅ Use core Excel formulas to solve business problems.
✅ Calculate Revenue, Orders, Average Order Value (AOV), KPI and Bonus.
✅ Use SUMIFS, COUNTIFS, AVERAGEIFS, IF, AND, OR, IFERROR, ROUND in real-world situations.
✅ Check formula logic and reconcile results instead of relying only on whether Excel reports an error.
✅ Complete a workbook following the process:
RAW DATA → CLEAN DATA → KPI TABLE 📊
⏱️ 60 minutes
You will learn how to read and organize a standard business dataset:
🔹 Row, Column, Record, Field, Header 🔹 Distinguish Text / Number / Date data 🔹 Get familiar with Excel Table 🔹 Sort, Filter, Freeze Panes 🔹 Important rule: 1 row = 1 transaction, 1 column = 1 attribute 🔹 Identify layout errors such as Merge Cell, blank rows, or placing total rows in the middle of the data range.
💡 Practice: Work directly with a sample sales file of about 500–1.000 rows, convert data into an Excel Table, and filter data by region, product, and status.
📁 Output deliverable: 01_DATA_STANDARDIZED
⏱️ 45 minutes
Real-world data is rarely perfect. Therefore, before calculating KPI, you need to know how to detect and handle common errors such as:
🧹 Blank / Null 🧹 Duplicate 🧹 Extra spaces 🧹 Inconsistent text 🧹 Inconsistent dates 🧹 Number stored as Text 🧹 Inconsistent region, department, or status names.
💡 Practice: Detect 8–10 intentionally planted errors in the dataset, then clean them and note cases that require manual checking.
📁 Output deliverable: 02_CLEAN_DATA
⏱️ 120 minutes
This is the core module of the course 🔥
You will learn how to use groups of Excel functions that are frequently used in business problems:
📌 SUM — aggregate data 📌 SUMIFS — sum by condition 📌 COUNTIFS — count transactions by condition 📌 AVERAGEIFS — average by condition 📌 IF — classify results 📌 AND / OR — combine multiple business conditions 📌 IFERROR — handle display errors 📌 ROUND — round numbers 📌 Some Text / Date functions needed for each problem.
💰 Calculate Total Revenue 🧾 Calculate Total Orders 📊 Calculate Average Order Value (AOV) 👤 Analyze revenue by employee 🌍 Analyze revenue by region 🎯 Determine Met / Not Met KPI status 🎁 Calculate bonuses based on revenue and KPI conditions.
In particular, the course does not only focus on “writing correct syntax”, but also guides you on how to check formula logic and reconcile results.
📁 Output deliverable: 03_KPI_CALCULATION
⏱️ 45 minutes
In the final part, you will connect all the knowledge you have learned into a complete business scenario.
📌 Context:
You are a Business Department support staff. A manager sends you a sales file with data errors and asks you to quickly create a KPI table to evaluate employee performance.
You will:
➡️ Read the business requirements ➡️ Identify the metrics to calculate ➡️ Identify the data source ➡️ Complete the KPI table ➡️ Check sample results ➡️ Detect and handle errors in the workbook.
You will practice calculating:
💰 Revenue 🧾 Orders 📊 AOV ↩️ Return Rate 🎯 KPI Status 🎁 Bonus
📁 Output deliverable: A complete workbook including:
RAW DATA → CLEAN DATA → KPI TABLE
This is the part that helps you verify whether you can actually do it or not.
You will start with a sales file containing data errors and complete the entire process yourself:
Standardize the data structure and convert it into an Excel Table.
Handle basic errors:
🧹 Blank 🔄 Duplicate 🔢 Number / Text 📅 Dates
Calculate the metrics:
💰 Total Revenue 🧾 Total Orders 📊 Average Order Value ↩️ Return Rate
Determine employees who Met / Not Met KPI according to the provided conditions.
Calculate Bonus using IF combined with AND/OR and manually check at least 3 cases.
📄 01_RAW_DATA — original data kept unchanged
📄 02_CLEAN_DATA — cleaned data
📄 03_KPI_TABLE — complete KPI table
📝 Short notes on the data errors detected.
More importantly, the workbook must ensure formulas are logically correct, do not change the original data, include a method for reconciling results, and have a readable layout.
This is not about learning Excel by “memorizing functions” ❌
Instead, the course follows this method:
Each concept is implemented in a cycle:
Problem → Formula/Operation → Check → Fix Errors 🔄
The instructor focuses on the thinking behind choosing formulas and how to check results, helping you understand the essence instead of just memorizing syntax.
☑️ Understand standard tabular data ☑️ Clean basic data errors ☑️ Use SUMIFS / COUNTIFS / AVERAGEIFS ☑️ Use IF / AND / OR ☑️ Calculate basic KPI ☑️ Know how to Verify and reconcile results ☑️ Complete an Excel workbook following a real-world workflow.
💡 No unfocused learning — focus on Excel skills that are highly applicable at work.
💡 Not just learning formulas — you also learn how to read data, clean data, and check results.
💡 Learn with real-world data — the course is filled with datasets and problems set in a business context.
💡 Clear output deliverables — at the end of the course, you complete a workbook from raw data to a KPI table.
💡 Build a foundation for advanced learning — the course 1 workbook can continue to be used as input for Excel Business Analytics, where learners continue with Lookup, advanced Data Cleaning, and PivotTable.
⏱️ Duration: About 5 hours / 300 minutes 🎯 Approach: Concise – Easy to apply – With output deliverables 💼 Method: Learn through workflows and real-world problems 📊 Focus: Data – Formula – KPI 👨💻 Learning format: Learn and practice directly on the dataset throughout the course.
Excel is not just cells and formulas.
The important thing is that you know:
📥 Receive data → 🧹 Clean → 🧮 Calculate → 🎯 Measure KPI → ✅ Check → 📊 Create reports
And that is the foundational capability that Excel Business Essentials aims for.
Course Content
0/31 lessons done
0 Rating and review
No comment
goldAI xử lý dữ liệu và báo cáo Excel
📊 AI EXCEL DATA & REPORTING Xử lý dữ liệu, làm sạch và xây dựng báo cáo với AI Bạn đã biết sử dụng Excel cơ bản và có...5h 24m of video
28 video lectures
4 Chapter
31 Lessons
31 practice quizzes
66 reading resources
Mock interview included
4 capstone project
1 Students
24/7 mentor support
Certificate of completion
Learn on any device