 eduzyeduzy
Intermediate
28 Lessons
5h 34m of video
1 Students
Certificate of Completion
You analyze very carefully. You send your manager 5, 6 Pivot tables with data accurate to every row.
A few minutes later, the manager replies with exactly one sentence:
💬 "So what is the conclusion?"
The problem is not the data. The data can all be correct. The problem is that the reader has to go find what matters themselves, while they only have a few minutes before the meeting. ⏳
This course helps you solve exactly that problem. ✅
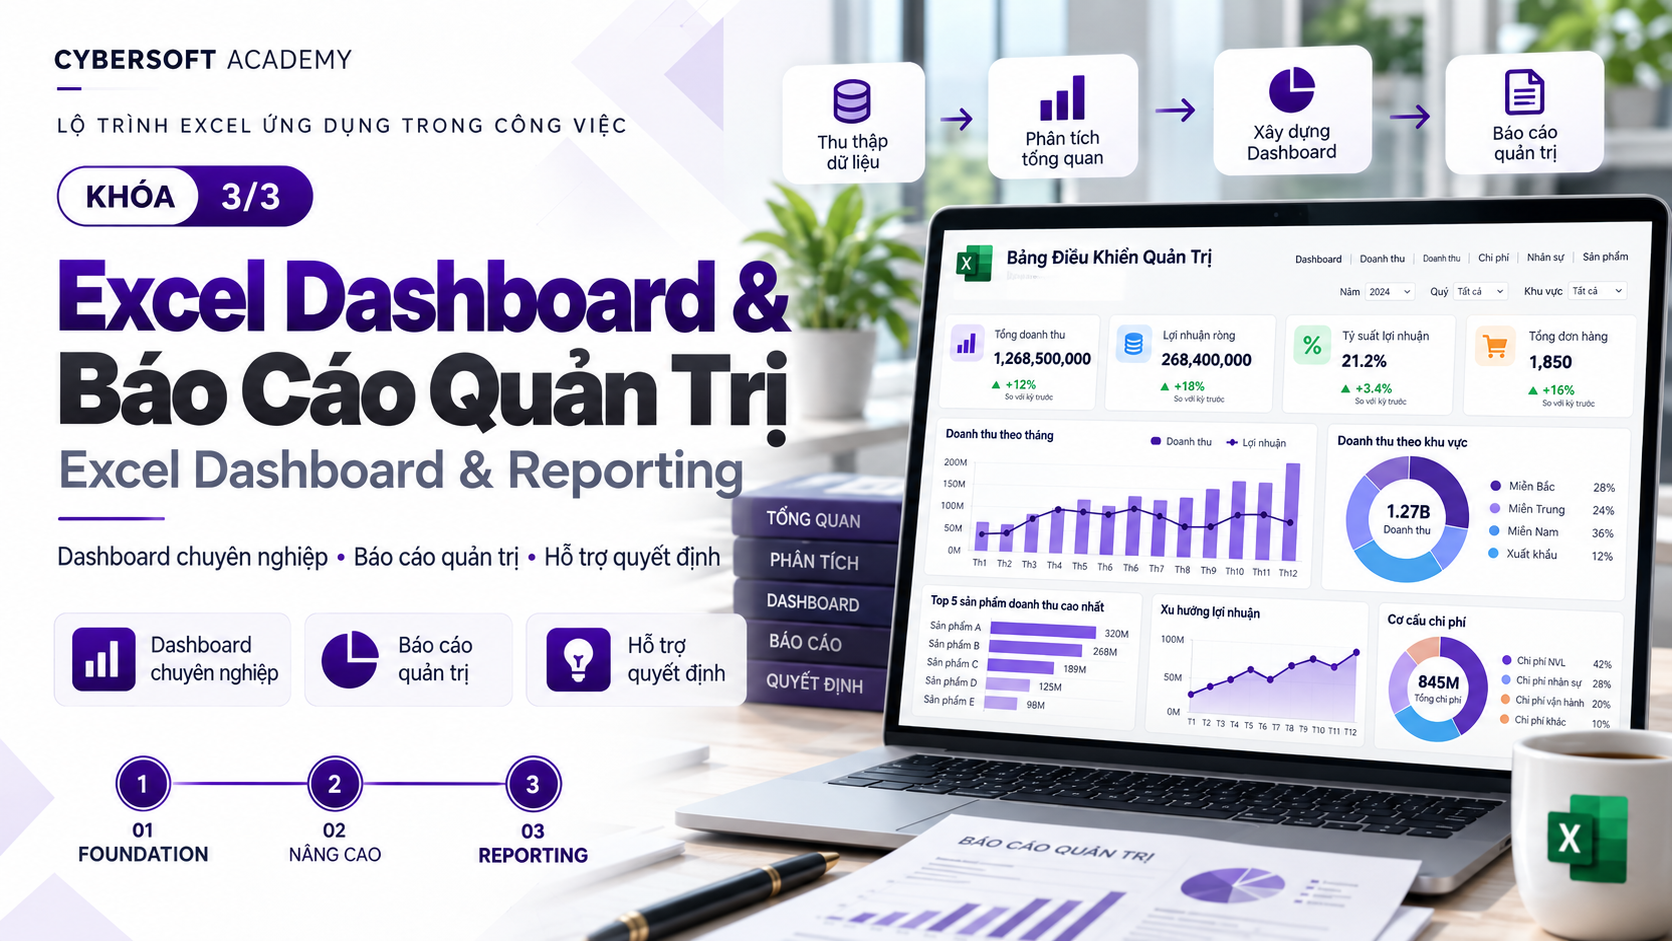
🖥️ A sales dashboard condensed into 1 page: key KPIs at the top with previous-period comparison, below are trends, breakdown by region and product group, Top/Bottom employees.
🎛️ A dashboard filterable with one click: select a region or a month, all KPI cards and charts change at the same time.
🚨 Anomalies stand out automatically: cells colored by threshold, helping viewers immediately see where to pay attention.
✍️ Business Summary in 5–8 lines: with data, with a comparison period, with recommended actions, so managers read it and understand and can decide.
🔍 Data reconciliation table: prove that every number on the dashboard matches the source data before sending it out.
📄 A 1-page PDF report ready to send to your boss: no detailed data exposed, no accidental filtering, file name standardized by reporting period.
🎤 A 3-minute dashboard presentation: go straight to the conclusion, insight, and action.
We do not open Excel and draw charts first. We start with the question: what decision does the viewer need to make?
❓ Question → 📏 KPI → 📈 Chart → 🖥️ Dashboard → 🔍 Verification → 💡 Insight → 📤 Safe sharing
Guiding principle throughout: Build → Verify → Share. Do not send a dashboard before reconciling the data.
🚀 Kickoff: From Pivot tables to a 1-page dashboard Preview the final course product and take a 10-minute challenge to record your own starting point.
🧩 Module 1: From manager questions to charts that answer the right focus "Transform" a hard-to-read chart in the first 10 minutes, turn management questions into KPIs, choose the right chart for 6 business questions, and write titles that state the conclusion directly.
🧮 Module 2a: Build KPI Card and auto-updating PivotChart Calculate Revenue, Orders, AOV, Return Rate correctly, create KPI Card with GETPIVOTDATA, and build PivotChart that updates automatically when the data changes.
🎛️ Module 2b: Turn the dashboard into a tool for filtering and issue detection Add Slicer and Timeline, lay out a 1-screen dashboard in reading order, compare with the previous period, rank Top/Bottom, and highlight anomalies.
💡 Module 3: Write insight and Business Summary that help managers make decisions Write headlines with numbers and comparison periods, apply the WHAT → WHERE/WHO → WHY/HYPOTHESIS → ACTION framework, and distinguish real insight from fake insight.
🛡️ Module 4: Verify, fix errors, and send reports safely "Diagnose" 5 common dashboard errors, create a reconciliation table, prevent detailed data leakage, and package a 1-page PDF.
🏆 Module 5: Final Business Case (Capstone) Redo the entire process yourself with a completely new dataset, from reading the brief to submitting the workbook + PDF + Business Summary.
🎤 Wrap-up: Present your dashboard and measure your progress Present the dashboard in 3 minutes, retake the course-start challenge, and compare before/after yourself.
⏸️ Every video has a "Pause & Practice" point: you pause the video, open the file, and work right in your own workbook.
📁 One workbook throughout: each module adds a new sheet (chart, dashboard, summary, reconciliation). By the time you finish, you have a complete reporting set ready.
✅ Checklist at the end of each module: check for yourself whether your work meets the bar before moving on.
💬 Q&A Area: post before/after work, ask questions, and get feedback throughout the course.
📈 See your own progress: your course-start and course-end work are placed side by side, compared using the same 4 criteria.
🎬 26 short videos, about 2 hours total, each video focuses on one specific skill
✍️ About 4 hours of practice per lesson, plus about 90 minutes to complete the Capstone project
📦 Included materials: a sales dataset of ~2,000 rows, exercise files for each video, answer files, a Business Summary template, Capstone Brief, and grading rubric
👩💼 Sales staff, sales admin, accounting, HR, operations... who frequently create Excel reports to send to managers
📊 Analysts who want their reports to be read, understood, and used to make decisions
🧑💻 Team leads and managers who want to build their own dashboard to track their team's performance
💻 Excel Microsoft 365 or Excel 2021 and above (videos recorded on Excel Microsoft 365 for Windows, English interface)
🔢 Already know how to create PivotTable at a basic level
⏰ Each session is about 30–60 minutes, learn at your own pace
Next time you send a report, your manager will not have to ask "So what is the conclusion?" anymore, because the conclusion is right on the first page. 💪
👉 Start with Video K.1 and take the 10-minute challenge today!
7 chapters
28 lessons
5h 34m of video
1 Students
24/7 mentor support
Certificate of completion
Learn on any device
1,000,000 VND
499,000 VND
/ 1 months
7 Chapter · 28 Lessons · 5h 34m of video
2 Lessons • 8 min
K.1 Preview the destination: the one-page sales dashboard you will build yourself
Preview5:02K.2 Initial challenge: build 1 chart + write 1 insight sentence in 10 minutes
Preview3:195 Lessons • 52 min
1.1 Quick win: “transform” a hard-to-read revenue chart in 10 minutes
Preview17:591.2 Turn management questions into 4 measurable KPIs: create the KPI_DEFINITION table
Preview9:151.3 Choose the right chart for 6 business questions: build Line, Bar, Combo from PivotTable
Preview24:591.4 Write conclusion-driven titles (what + number + period) and clean out unnecessary decoration
Capstone Module 1 Project
3 Lessons • 52 min
2a.1 Calculate Revenue, Orders, AOV, Return Rate correctly: avoid counting rows instead of orders
21:042a.2 Create 4 KPI Cards linked to PivotTable using GETPIVOTDATA
20:042a.3 Build 3 PivotCharts by trend, region, product group and add them to the dashboard
11:295 Lessons • 1 hr 13 min
2b.1 Attach Slicer, Timeline and Report Connections so the whole dashboard filters together
14:082b.2 One-screen dashboard layout in 4 layers: KPI → Trend → Breakdown → Top/Bottom
20:042b.3 Compare with previous period, rank Top/Bottom 5 employees and highlight anomalies
29:172b.4 Try each filter: verify dashboard still gives correct numbers when filtering
10:15Capstone Module 2 Project
5 Lessons • 1 hr 18 min
3.1 Write 3 headlines with metrics and comparison period from your own dashboard
16:003.2 Analyze an insight using the WHAT → WHERE/WHO → WHY/HYPOTHESIS → ACTION framework
25:113.3 Real insight or fake insight? Self-check and fix your headline
14:513.4 Write a 5–8 line Business Summary and do the “30-second test”
21:40Capstone Module 3 Project
5 Lessons • 58 min
4.1 “Troubleshoot” dashboard: find and fix 5 common errors
17:594.2 Create a 06_CHECK reconciliation table to prove every number matches the source data
15:064.3 Send PDF or workbook? Block detailed data leaks before sharing
13:084.4 Package a report to send to your boss: 1-page print area, export PDF, standard file naming
11:58Capstone Module 4 Project
3 Lessons • 12 min
5.1 Review the Build → Verify → Share process before starting Capstone
1:385.2 Read the Capstone Brief, choose KPI and sketch the dashboard layout
3:535.3 Build, Validate, and Submit a Complete Report Set: workbook + PDF + Business Summary
5:370 Rating and review
No comment
 gold
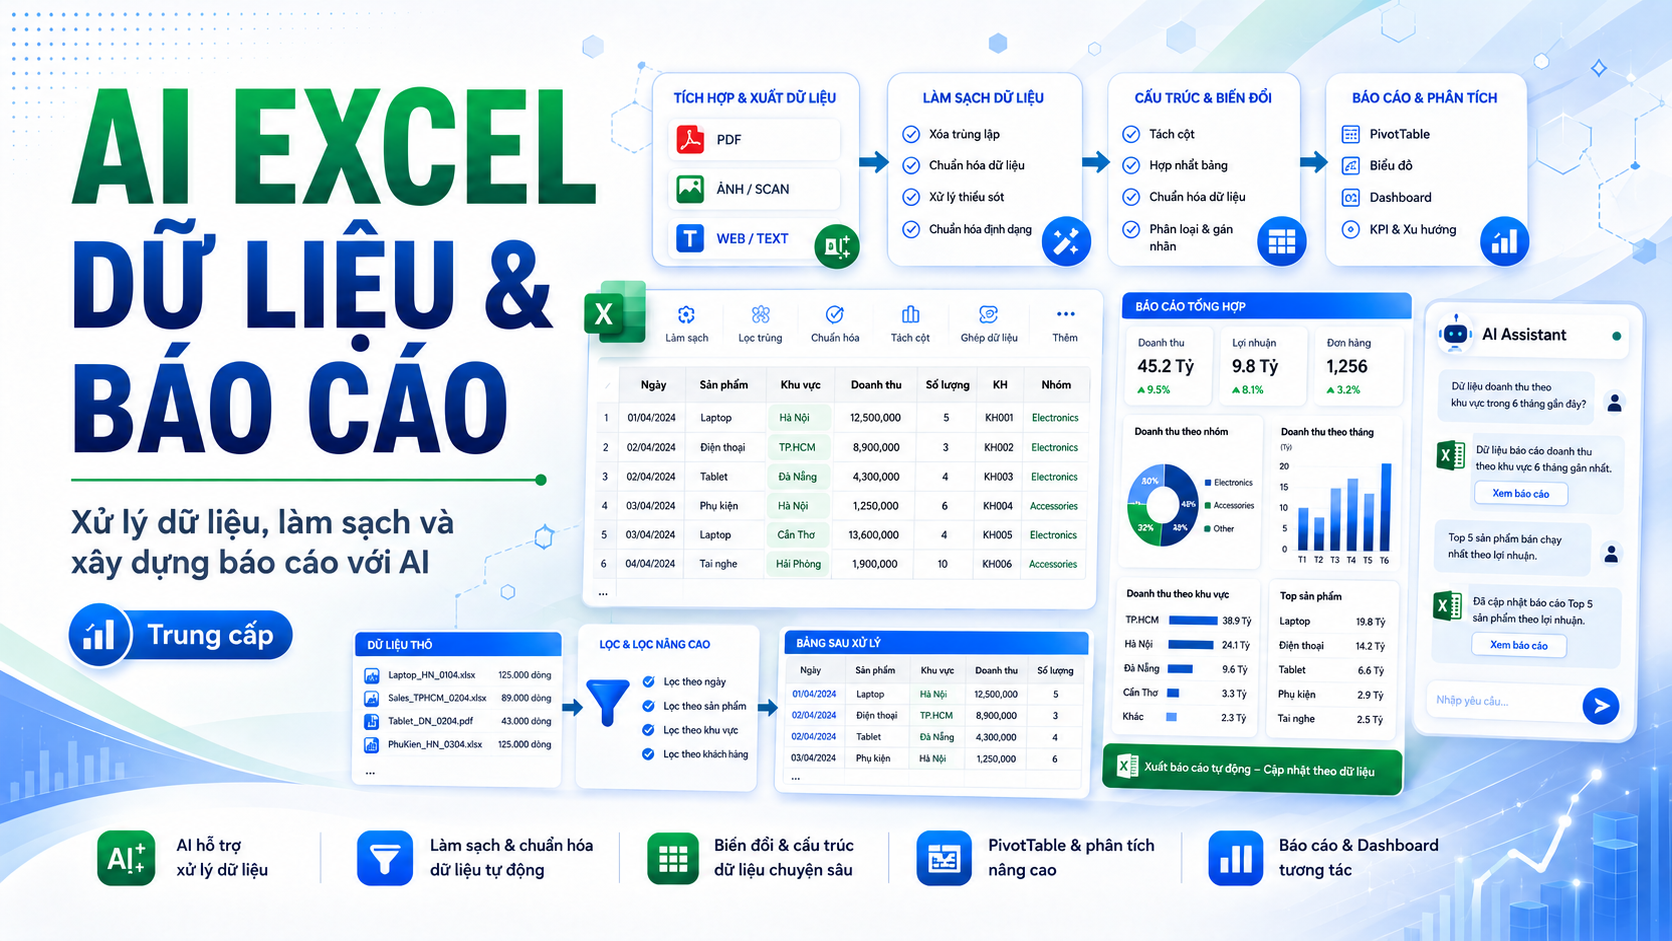
AI xử lý dữ liệu và báo cáo Excel
📊 AI EXCEL DATA & REPORTING Xử lý dữ liệu, làm sạch và xây dựng báo cáo với AI Bạn đã biết sử dụng Excel cơ bản và có...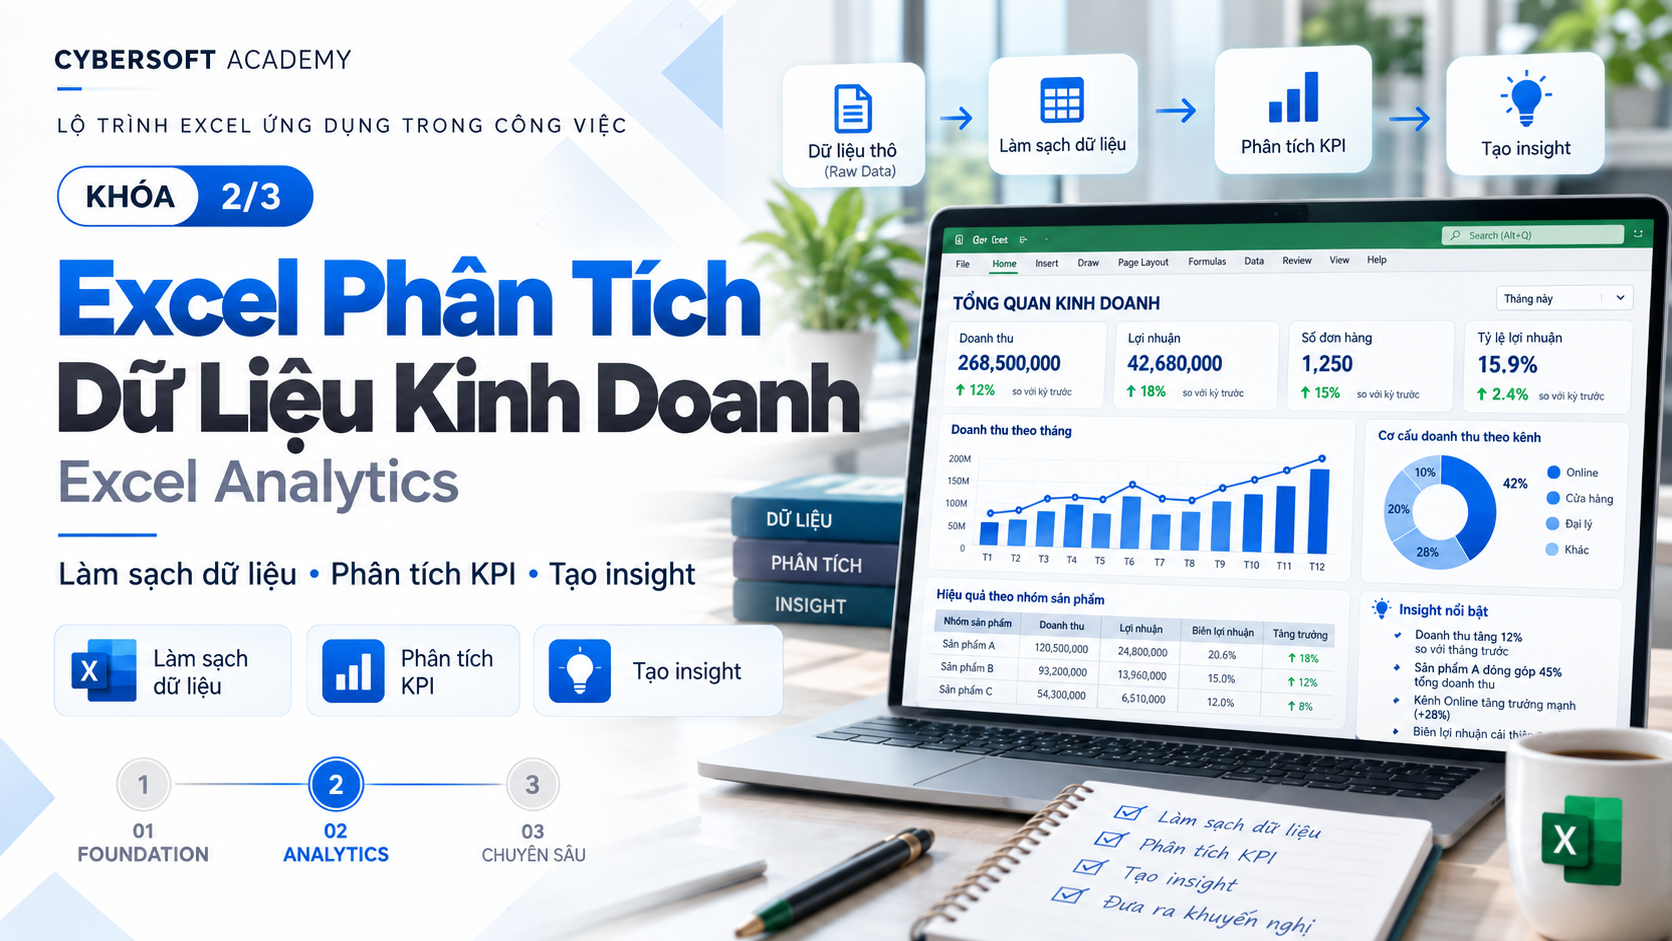
Chuẩn bị và phân tích dữ liệu kinh doanh bằng Excel
📊 EXCEL BUSINESS ANALYTICS – PHÂN TÍCH DỮ LIỆU KINH DOANH VỚI EXCEL Bạn đã biết sử dụng Excel nhưng vẫn mất nhiều thời...You analyze very carefully. You send your manager 5, 6 Pivot tables with data accurate to every row.
A few minutes later, the manager replies with exactly one sentence:
💬 "So what is the conclusion?"
The problem is not the data. The data can all be correct. The problem is that the reader has to go find what matters themselves, while they only have a few minutes before the meeting. ⏳
This course helps you solve exactly that problem. ✅
🖥️ A sales dashboard condensed into 1 page: key KPIs at the top with previous-period comparison, below are trends, breakdown by region and product group, Top/Bottom employees.
🎛️ A dashboard filterable with one click: select a region or a month, all KPI cards and charts change at the same time.
🚨 Anomalies stand out automatically: cells colored by threshold, helping viewers immediately see where to pay attention.
✍️ Business Summary in 5–8 lines: with data, with a comparison period, with recommended actions, so managers read it and understand and can decide.
🔍 Data reconciliation table: prove that every number on the dashboard matches the source data before sending it out.
📄 A 1-page PDF report ready to send to your boss: no detailed data exposed, no accidental filtering, file name standardized by reporting period.
🎤 A 3-minute dashboard presentation: go straight to the conclusion, insight, and action.
We do not open Excel and draw charts first. We start with the question: what decision does the viewer need to make?
❓ Question → 📏 KPI → 📈 Chart → 🖥️ Dashboard → 🔍 Verification → 💡 Insight → 📤 Safe sharing
Guiding principle throughout: Build → Verify → Share. Do not send a dashboard before reconciling the data.
🚀 Kickoff: From Pivot tables to a 1-page dashboard Preview the final course product and take a 10-minute challenge to record your own starting point.
🧩 Module 1: From manager questions to charts that answer the right focus "Transform" a hard-to-read chart in the first 10 minutes, turn management questions into KPIs, choose the right chart for 6 business questions, and write titles that state the conclusion directly.
🧮 Module 2a: Build KPI Card and auto-updating PivotChart Calculate Revenue, Orders, AOV, Return Rate correctly, create KPI Card with GETPIVOTDATA, and build PivotChart that updates automatically when the data changes.
🎛️ Module 2b: Turn the dashboard into a tool for filtering and issue detection Add Slicer and Timeline, lay out a 1-screen dashboard in reading order, compare with the previous period, rank Top/Bottom, and highlight anomalies.
💡 Module 3: Write insight and Business Summary that help managers make decisions Write headlines with numbers and comparison periods, apply the WHAT → WHERE/WHO → WHY/HYPOTHESIS → ACTION framework, and distinguish real insight from fake insight.
🛡️ Module 4: Verify, fix errors, and send reports safely "Diagnose" 5 common dashboard errors, create a reconciliation table, prevent detailed data leakage, and package a 1-page PDF.
🏆 Module 5: Final Business Case (Capstone) Redo the entire process yourself with a completely new dataset, from reading the brief to submitting the workbook + PDF + Business Summary.
🎤 Wrap-up: Present your dashboard and measure your progress Present the dashboard in 3 minutes, retake the course-start challenge, and compare before/after yourself.
⏸️ Every video has a "Pause & Practice" point: you pause the video, open the file, and work right in your own workbook.
📁 One workbook throughout: each module adds a new sheet (chart, dashboard, summary, reconciliation). By the time you finish, you have a complete reporting set ready.
✅ Checklist at the end of each module: check for yourself whether your work meets the bar before moving on.
💬 Q&A Area: post before/after work, ask questions, and get feedback throughout the course.
📈 See your own progress: your course-start and course-end work are placed side by side, compared using the same 4 criteria.
🎬 26 short videos, about 2 hours total, each video focuses on one specific skill
✍️ About 4 hours of practice per lesson, plus about 90 minutes to complete the Capstone project
📦 Included materials: a sales dataset of ~2,000 rows, exercise files for each video, answer files, a Business Summary template, Capstone Brief, and grading rubric
👩💼 Sales staff, sales admin, accounting, HR, operations... who frequently create Excel reports to send to managers
📊 Analysts who want their reports to be read, understood, and used to make decisions
🧑💻 Team leads and managers who want to build their own dashboard to track their team's performance
💻 Excel Microsoft 365 or Excel 2021 and above (videos recorded on Excel Microsoft 365 for Windows, English interface)
🔢 Already know how to create PivotTable at a basic level
⏰ Each session is about 30–60 minutes, learn at your own pace
Next time you send a report, your manager will not have to ask "So what is the conclusion?" anymore, because the conclusion is right on the first page. 💪
👉 Start with Video K.1 and take the 10-minute challenge today!
Course Content
0/28 lessons done
0 Rating and review
No comment
goldAI xử lý dữ liệu và báo cáo Excel
📊 AI EXCEL DATA & REPORTING Xử lý dữ liệu, làm sạch và xây dựng báo cáo với AI Bạn đã biết sử dụng Excel cơ bản và có...Chuẩn bị và phân tích dữ liệu kinh doanh bằng Excel
📊 EXCEL BUSINESS ANALYTICS – PHÂN TÍCH DỮ LIỆU KINH DOANH VỚI EXCEL Bạn đã biết sử dụng Excel nhưng vẫn mất nhiều thời...1.000.000 VND
499.000 VND
5h 34m of video
24 video lectures
7 Chapter
28 Lessons
73 reading resources
Mock interview included
5 capstone project
1 Students
24/7 mentor support
Certificate of completion
Learn on any device