 eduzyeduzy
Intermediate
39 Lessons
34h 17m of video
1 Students
Certificate of Completion
You already know basic Excel and can write Prompts for AI, but when you step into real data, everything starts to become more complicated?
You often encounter situations like:
AI EXCEL DATA & REPORTING was built to help you solve that entire process.
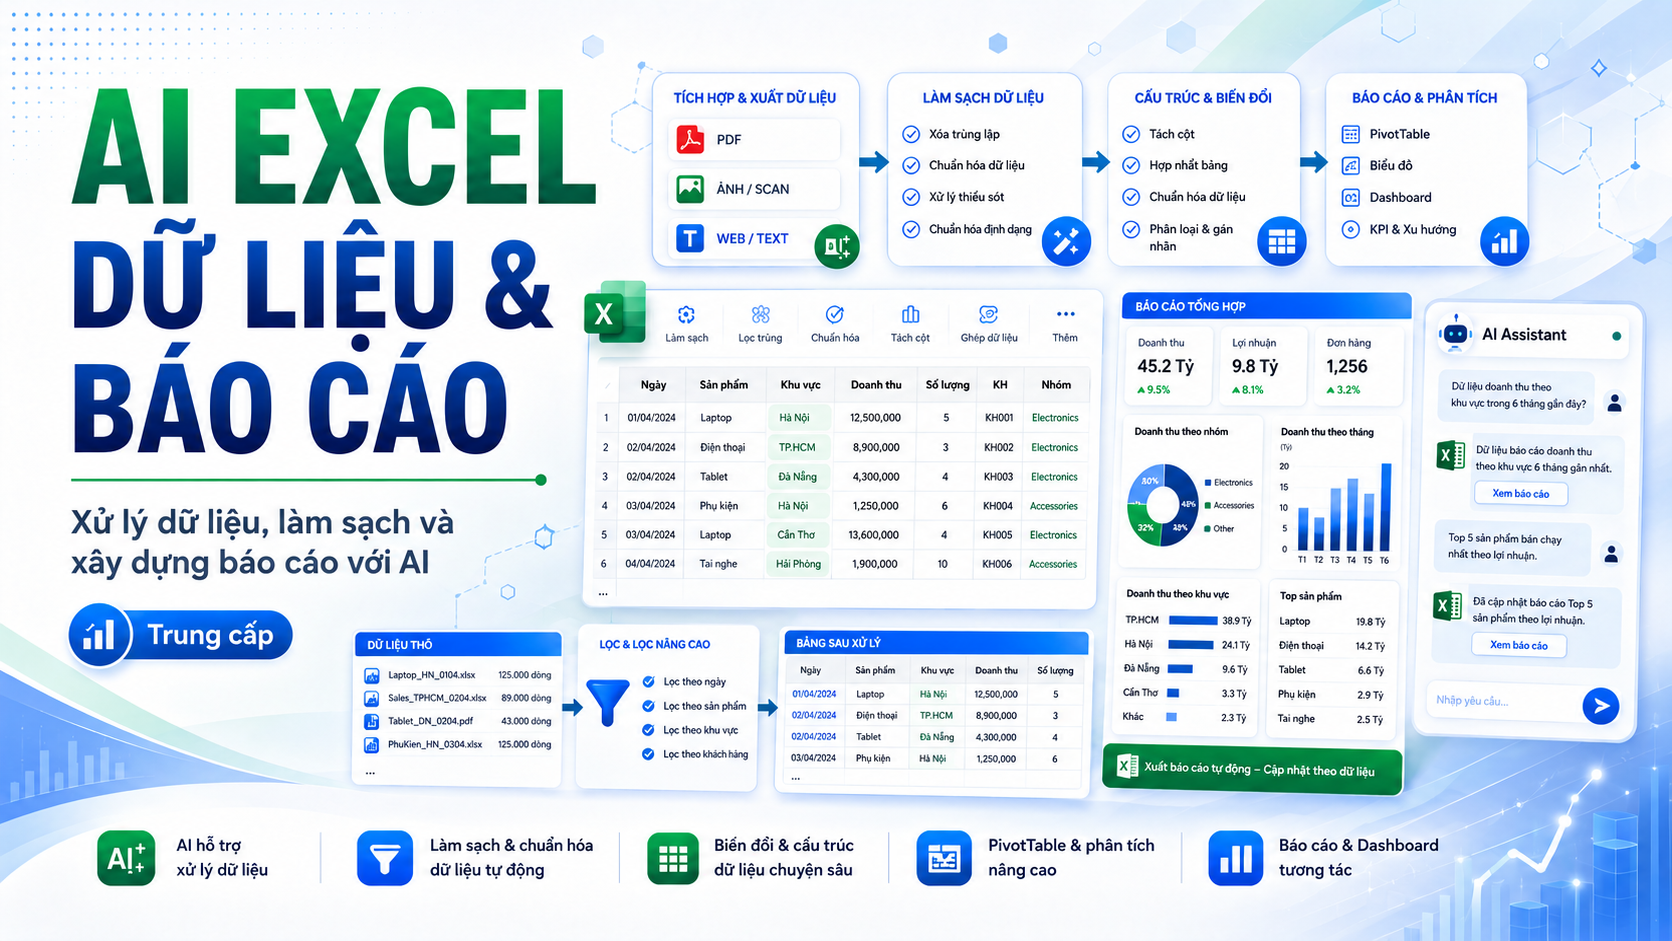
This is an Intermediate-level course, focused on using Excel combined with AI to turn raw data into clean, structured data and finally into a report that can be used in real work.
After the course, you can:
✨ Use AI to assist in handling multi-condition Excel formulas.
✨ Analyze the problem before asking AI to write formulas.
✨ Extract data from PDFs, images, text, and various data tables.
✨ Clean data that is erroneous, has extra whitespace, wrong formatting, duplicates, or anomalies.
✨ Standardize data to be ready for aggregation and analysis.
✨ Split, merge, and reorganize data according to work requirements.
✨ Translate and standardize bilingual data while keeping the Excel table structure intact.
✨ Aggregate data using SUMIFS, COUNTIFS, AVERAGEIFS, and PivotTable.
✨ Know when to use formulas, PivotTable, or AI assistance.
✨ Build more professional revenue reports and management reports.
✨ Ask AI to help write comments, insights, and Executive Summary based on real numbers.
When a problem no longer has just one condition, you need to know how to describe the requirements to AI more precisely.
You will practice with:
More importantly, you will learn how to analyze the problem before writing the formula:
You will also know how to ask AI to break down, review, and rewrite complex formulas to make them easier to understand and maintain.
Work data isn't always already in a neat, complete Excel table.
It can be in:
You will learn how to use AI to help recognize, extract, and convert data into a structured format.
Additionally, the course covers Excel tools such as:
You will also practice splitting a master data table into multiple groups like:
Business, Marketing, Accounting, Human Resources.
Build a complete process from:
PDF or images → AI processing → Excel → Data standardization.
A good report must start with good data.
You will learn how to detect common problems such as:
Tools to practice include:
You will also learn how to classify duplicate data into:
In particular, you will know how to ask AI to create a data quality checklist before using the data for reports.
Merge three Excel files and perform the entire process:
Merge data, clean, standardize, check, and create a complete data table.
When working with English reports or data from multiple countries, manually translating each cell takes a lot of time.
In this chapter, you will learn how to use AI to:
You will practice with contexts such as:
💰 Finance. 👥 Human Resources. 💻 Technology. 📈 Business.
In addition, you will build a Glossary – a standard bilingual terminology table so that AI uses it consistently throughout the report.
After the data is clean, the next step is turning thousands of data rows into meaningful numbers.
You will learn two important groups of methods:
More importantly, you will understand:
When should you use formulas? When should you use PivotTable? When should you ask AI for help?
The goal is not to use as many tools as possible, but to choose the right tool for the right problem.
This section helps you transition from a data processor to a creator of decision-supporting information.
Before building a report, you will learn to answer 5 questions:
Then, you will use AI to help propose a suitable report structure.
You will practice creating revenue reports by:
A table of numbers is not yet a complete report.
You will learn to use AI to assist in:
However, the course applies an important principle:
Numbers first → Comments after → Verify the numbers again.
AI assists in writing, but users still need to control the accuracy of the report.
A manager doesn't always have time to read dozens of data tables.
You will learn to use AI to create a short but valuable Executive Summary, following the structure:
Key Results → Notable Points → Issues → Recommendations
The goal is to help readers quickly understand:
You will receive data from multiple sources and perform a complete process:
This exercise helps you connect all the knowledge in the course into a real-world data processing and reporting workflow.
The course is suitable for:
📊 Office employees who frequently handle Excel data.
💰 Accounting, finance, business, or operations staff.
👥 HR staff who need to compile employee data and reports.
📈 Sales and Marketing professionals who need to aggregate and track numbers.
📑 People who frequently have to prepare reports for management.
🎓 Students who already have an Excel foundation and want to advance their data processing skills.
🤖 People who already know how to use ChatGPT and prompts but want to apply AI more deeply to Excel.
The course doesn't just teach:
“Which tool do you click in Excel?”
It focuses on a more important capability:
“How do you turn raw data into valuable information with the support of Excel and AI?”
You will go through the entire workflow:
Raw Data → Extraction → Cleaning → Standardization → Aggregation → Analysis → Report → Executive Summary
Each step combines:
🧠 Data processing mindset 📊 Excel skills 🤖 AI support capability
“I can turn raw data into a complete Excel report with the support of AI.”
You don't only know how to use a few more Excel functions.
You will understand a complete data workflow:
Receive data → Check → Clean → Standardize → Aggregate → Analyze → Present → Provide comments.
🚀 AI EXCEL DATA & REPORTING is the next step for you to upgrade from an Excel user to someone capable of processing data and building professional reports with AI.
6 chapters
39 lessons
34h 17m of video
1 Students
24/7 mentor support
Certificate of completion
Learn on any device
899,000 VND
399,000 VND
/ 1 months
6 Chapter · 39 Lessons · 34h 17m of video · 38 practice quizzes
5 Lessons • 2 hr 35 min
Course Introduction
Preview13:091.1. Building multi-condition formulas with AI
Preview49:411.2. Analyzing requirements to select and write correct formulas
Preview53:031.3. Detecting errors and fixing complex formulas with AI
Preview39:23Capstone Lesson Chapter 1
Preview8 Lessons • 6 hr 41 min
2.1. Identifying data to extract from multiple sources
Preview1:01:342.2. Extracting data from PDF to Excel
32:102.3. Converting data from images into Excel tables
45:152.4. Splitting and processing data from text strings
1:00:022.5. Filtering and extracting data by multiple conditions
45:382.6. Splitting one column into multiple columns by pattern
1:15:252.7. Splitting a data table into multiple tables as required
1:20:54Capstone Lesson Chapter 2
8 Lessons • 7 hr 47 min
3.1. Detecting dirty data and identifying errors to handle
1:24:003.2. Cleaning whitespace and extra characters
49:283.3. Standardizing text to the same format
31:513.4. Split and merge tables, and consolidate multiple data sources
2:00:193.5. Detect and handle duplicate data
39:573.6. Detect anomalies using Excel and AI
1:26:063.7. Check data quality before use
55:46Capstone Lesson Chapter 3
6 Lessons • 4 hr 38 min
4.1. Translate Excel data into the target language using AI
1:17:094.2. Translate data without changing the table structure
43:564.3. Translate accurately according to each business context
39:184.4. Build and use a bilingual glossary
1:24:004.5. Check and fix translation errors with AI
34:16Capstone Lesson Chapter 4
5 Lessons • 3 hr 54 min
5.1. Choose the appropriate aggregation method for each problem
1:00:295.2. Aggregate data with multiple conditions using formulas
1:29:355.3. Build summary reports using PivotTable
53:325.4. Choosing Formulas, PivotTable or AI for each situation
29:38Capstone Lesson Chapter 5
7 Lessons • 8 hr 42 min
6.1. Identify report requirements with AI
1:33:166.2. Asking AI to Propose Report Structure
1:03:416.3. Practice building revenue reports
2:07:546.4. Use AI to analyze and write commentary
1:04:186.5. Turn reports into management support tools
1:37:396.6. Write Executive Summary with AI
1:04:27Final Capstone Project
10:370 Rating and review
No comment

Xây dựng AI Agent với OpenClaw & N8N - Xây dựng trợ lý 24/7 tự động qui trình, tự động đăng bài
Khóa học này là gì? Đây là khóa thực hành AI Agent thực tế, tự động hóa qui trình, đi thẳng vào làm ra sản phẩm chạy...You already know basic Excel and can write Prompts for AI, but when you step into real data, everything starts to become more complicated?
You often encounter situations like:
AI EXCEL DATA & REPORTING was built to help you solve that entire process.
This is an Intermediate-level course, focused on using Excel combined with AI to turn raw data into clean, structured data and finally into a report that can be used in real work.
After the course, you can:
✨ Use AI to assist in handling multi-condition Excel formulas.
✨ Analyze the problem before asking AI to write formulas.
✨ Extract data from PDFs, images, text, and various data tables.
✨ Clean data that is erroneous, has extra whitespace, wrong formatting, duplicates, or anomalies.
✨ Standardize data to be ready for aggregation and analysis.
✨ Split, merge, and reorganize data according to work requirements.
✨ Translate and standardize bilingual data while keeping the Excel table structure intact.
✨ Aggregate data using SUMIFS, COUNTIFS, AVERAGEIFS, and PivotTable.
✨ Know when to use formulas, PivotTable, or AI assistance.
✨ Build more professional revenue reports and management reports.
✨ Ask AI to help write comments, insights, and Executive Summary based on real numbers.
When a problem no longer has just one condition, you need to know how to describe the requirements to AI more precisely.
You will practice with:
More importantly, you will learn how to analyze the problem before writing the formula:
You will also know how to ask AI to break down, review, and rewrite complex formulas to make them easier to understand and maintain.
Work data isn't always already in a neat, complete Excel table.
It can be in:
You will learn how to use AI to help recognize, extract, and convert data into a structured format.
Additionally, the course covers Excel tools such as:
You will also practice splitting a master data table into multiple groups like:
Business, Marketing, Accounting, Human Resources.
Build a complete process from:
PDF or images → AI processing → Excel → Data standardization.
A good report must start with good data.
You will learn how to detect common problems such as:
Tools to practice include:
You will also learn how to classify duplicate data into:
In particular, you will know how to ask AI to create a data quality checklist before using the data for reports.
Merge three Excel files and perform the entire process:
Merge data, clean, standardize, check, and create a complete data table.
When working with English reports or data from multiple countries, manually translating each cell takes a lot of time.
In this chapter, you will learn how to use AI to:
You will practice with contexts such as:
💰 Finance. 👥 Human Resources. 💻 Technology. 📈 Business.
In addition, you will build a Glossary – a standard bilingual terminology table so that AI uses it consistently throughout the report.
After the data is clean, the next step is turning thousands of data rows into meaningful numbers.
You will learn two important groups of methods:
More importantly, you will understand:
When should you use formulas? When should you use PivotTable? When should you ask AI for help?
The goal is not to use as many tools as possible, but to choose the right tool for the right problem.
This section helps you transition from a data processor to a creator of decision-supporting information.
Before building a report, you will learn to answer 5 questions:
Then, you will use AI to help propose a suitable report structure.
You will practice creating revenue reports by:
A table of numbers is not yet a complete report.
You will learn to use AI to assist in:
However, the course applies an important principle:
Numbers first → Comments after → Verify the numbers again.
AI assists in writing, but users still need to control the accuracy of the report.
A manager doesn't always have time to read dozens of data tables.
You will learn to use AI to create a short but valuable Executive Summary, following the structure:
Key Results → Notable Points → Issues → Recommendations
The goal is to help readers quickly understand:
You will receive data from multiple sources and perform a complete process:
This exercise helps you connect all the knowledge in the course into a real-world data processing and reporting workflow.
The course is suitable for:
📊 Office employees who frequently handle Excel data.
💰 Accounting, finance, business, or operations staff.
👥 HR staff who need to compile employee data and reports.
📈 Sales and Marketing professionals who need to aggregate and track numbers.
📑 People who frequently have to prepare reports for management.
🎓 Students who already have an Excel foundation and want to advance their data processing skills.
🤖 People who already know how to use ChatGPT and prompts but want to apply AI more deeply to Excel.
The course doesn't just teach:
“Which tool do you click in Excel?”
It focuses on a more important capability:
“How do you turn raw data into valuable information with the support of Excel and AI?”
You will go through the entire workflow:
Raw Data → Extraction → Cleaning → Standardization → Aggregation → Analysis → Report → Executive Summary
Each step combines:
🧠 Data processing mindset 📊 Excel skills 🤖 AI support capability
“I can turn raw data into a complete Excel report with the support of AI.”
You don't only know how to use a few more Excel functions.
You will understand a complete data workflow:
Receive data → Check → Clean → Standardize → Aggregate → Analyze → Present → Provide comments.
🚀 AI EXCEL DATA & REPORTING is the next step for you to upgrade from an Excel user to someone capable of processing data and building professional reports with AI.
Course Content
0/39 lessons done
0 Rating and review
No comment
Xây dựng AI Agent với OpenClaw & N8N - Xây dựng trợ lý 24/7 tự động qui trình, tự động đăng bài
Khóa học này là gì? Đây là khóa thực hành AI Agent thực tế, tự động hóa qui trình, đi thẳng vào làm ra sản phẩm chạy...899.000 VND
399.000 VND
34h 17m of video
34 video lectures
6 Chapter
39 Lessons
38 practice quizzes
95 reading resources
Mock interview included
6 capstone project
1 Students
24/7 mentor support
Certificate of completion
Learn on any device